
 +86 18068001229


0102030405
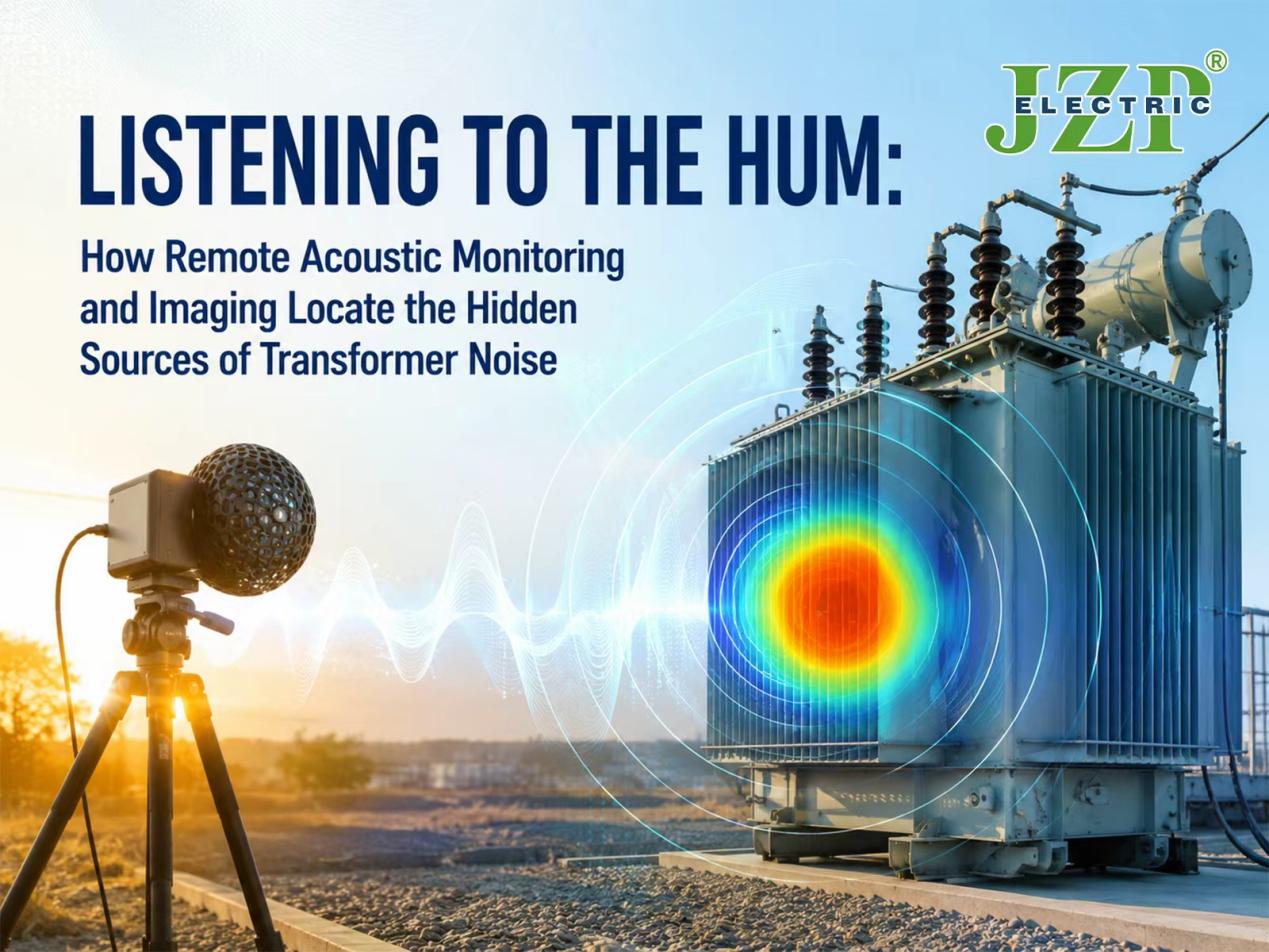
Listening to the Hum: How Remote Acoustic Monitoring and Imaging Locate the Hidden Sources of Transformer Noise
2026-05-07
Introduction
Most engineers know where transformer noise comes from. Not all of them know where it is coming from inside the transformer.
A single transformer can have multiple active noise sources: magnetostriction in specific core joints, electromagnetic forces in individual windings, loose clamping bolts in one corner, and cooling fans running slightly off-balance. Standard sound level measurements aggregate all these sources into a single number at the substation boundary. That is sufficient for regulatory compliance. It is useless for pinpointing the root cause.
The transformer that hums is not just making noise. It is broadcasting information about its condition. Recent advances in microphone array technology and acoustic imaging have made it possible to convert that broadcast into precise spatial maps—transforming noise from an environmental nuisance into a non-contact diagnostic tool.
Part One: What the Hum Actually Tells You
Transformer noise is not random. Under normal operation, the fundamental frequency is twice the power frequency (100 Hz or 120 Hz), generated by magnetostriction in the core. Harmonics at 200 Hz, 300 Hz, and higher frequencies carry additional information.
Different faults produce distinct acoustic signatures. Core looseness generates characteristic mechanical rattling superimposed on the fundamental. Partial discharge appears as sharp, broadband impulses detectable in the ultrasonic range. Loose connections produce intermittent arcing sounds. Winding deformation alters the balance of electromagnetic forces, shifting specific harmonic components.
The difficulty is that low-frequency noise—particularly below 400 Hz—has long wavelengths and propagates omni-directionally, making it extremely challenging to locate the exact source position using conventional handheld detectors. This is where acoustic array technology changes the equation.
Part Two: How Acoustic Imaging Detects the Inaudible
Acoustic imaging uses a microphone array to measure sound wave arrival times across channels. Beamforming algorithms reconstruct the acoustic energy distribution and overlay it as a colorcoded heatmap onto an optical image. The technology spans the audible (20 Hz–20 kHz) and ultrasonic (20 kHz–100 kHz) spectrum, so a single instrument can visualize both mechanical noise and partial discharge simultaneously.
Portable sixmicrophone 3D arrays now locate multiple sound sources and display each source’s acoustic power contribution—enabling engineers to target the most costeffective mitigation, not just the loudest noise.
For permanent monitoring, AIpowered acoustic fingerprint systems continuously compare realtime sound against baselines. Edgecomputing devices detect anomalies in milliseconds, suppress fan and wind interference via adaptive filters, and use CNNLSTM models to distinguish harmless background noise from genuine fault signatures missed by traditional alarms.
Part Three: Fixed vs Mobile—Which Approach Works Where
Neither method is universally better. The choice depends on the application.
Mobile acoustic imaging is ideal for periodic inspections, troubleshooting, and investigations after suspected events. Handheld or robot-mounted cameras: non-contact, operate at distances up to 200 meters, and produce instant visual results. One recent deployment of a walk-through robot equipped with an acoustic camera successfully identified multiple partial discharge and mechanical looseness sources across a large substation during a single autonomous inspection cycle.
Fixed acoustic monitoring suits critical transformers where continuous detection of developing faults is needed. Permanently installed sensor arrays analyze sound signatures 24/7. When deployed, these systems automatically alert operators when a parameter deviates from baseline, enabling conditionbased maintenance rather than reactive response. The 2026–2027 trend is integration with drone and robot platforms, acoustic cameras now being used for fully autonomous inspection sweeps of GIS switchgear and transformers.
For most substations, the optimal approach is a hybrid strategy: permanently monitor high-value assets with fixed sensors and periodically scan the rest of the fleet with mobile acoustic cameras to capture developing issues before they reach the critical stage.
Part Four: Standards and Procurement Considerations
The regulatory framework has matured. In 2024, standards like DL/T 27832024 (substation noise monitoring), IEEE 28242024 (acoustic imaging for HV equipment), and a CET guideline (voiceprint detection) were published. This means acoustic imaging is now a standard option with published test methods.
When specifying acoustic monitoring: for mobile inspection, consider microphone array resolution, detection distance (typically 50–200 m), and acousticoptical fusion. For fixed monitoring, specify sampling rate (≥48 kHz), edge AI capability (to reduce data transmission), and environmental protection (e.g., IP66). Also request manufacturer baselines and documented anomaly detection accuracy under real substation noise to avoid false alarms.
Conclusion
Transformer noise is not a nuisance to be mitigated and forgotten. It is a continuous broadcast of mechanical and electrical condition. Acoustic imaging and voiceprint monitoring turn that broadcast into visual intelligence, revealing the precise locations—core joints, windings, clamping structures—where problems begin.
For asset owners, the question is no longer whether to measure noise, but whether they can afford to ignore what it has been telling them all along.